In Advanced Data Visualization and Reporting, you’ll build the skills to turn complex data into clear, interactive dashboards, reports, and stories that help people make better decisions. This course is designed to feel different from a traditional course. Instead of moving through content in a fixed order, you’ll learn through the kinds of skills and job tasks you would see in a real data analytics, business intelligence, or reporting role.
Advanced Data Visualization and Reporting
Advanced Data Visualization and Reporting
This course is part of BI Dashboard Developer: Design, Build, and Deploy Dashboards Specialization

Instructor: Professionals from the Industry
Included with Learn more
Ask Coursera
Gain insight into a topic and learn the fundamentals.
Intermediate level
Recommended experience
2 weeks to complete
at 10 hours a week
Flexible schedule
Learn at your own pace
What you'll learn
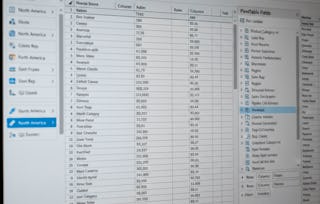
Build BI dashboards, optimize reports, and turn data into clear visual stories for business decisions.
Skills you'll gain
- Dashboard Creation
- Data Presentation
- Data Visualization Software
- Statistical Visualization
- Business Intelligence
- Analytics
- Data Validation
- Data Storytelling
- Data Analysis
- Key Performance Indicators (KPIs)
- Business Reporting
- Tableau Software
- Business Analytics
- Plot (Graphics)
- Data Visualization
- Business Metrics
- Performance Measurement
- Data Modeling
- Interactive Data Visualization
Tools you'll learn
Details to know

Shareable certificate
Add to your LinkedIn profile
Recently updated!
July 2026
Taught in English
See how employees at top companies are mastering in-demand skills

Build your subject-matter expertise
This course is part of the BI Dashboard Developer: Design, Build, and Deploy Dashboards Specialization
When you enroll in this course, you'll also be enrolled in this Specialization.
- Learn new concepts from industry experts
- Gain a foundational understanding of a subject or tool
- Develop job-relevant skills with hands-on projects
- Earn a shareable career certificate

There are 5 modules in this course
Earn a career certificate
Add this credential to your LinkedIn profile, resume, or CV. Share it on social media and in your performance review.
Instructor
513 Courses125,017 learners
Offered by
Explore more from Data Analysis
 Status: Free Trial
Coursera
 Status: Free Trial
 Status: Free Trial
Tableau Learning Partner
 Status: Free Trial
Why people choose Coursera for their career

Felipe M.
Learner since 2018
"To be able to take courses at my own pace and rhythm has been an amazing experience. I can learn whenever it fits my schedule and mood."

Jennifer J.
Learner since 2020
"I directly applied the concepts and skills I learned from my courses to an exciting new project at work."

Larry W.
Learner since 2021
"When I need courses on topics that my university doesn't offer, Coursera is one of the best places to go."

Chaitanya A.
"Learning isn't just about being better at your job: it's so much more than that. Coursera allows me to learn without limits."
Advance your career with an online degree
Earn a degree from world-class universities - 100% online


¹ Some assignments in this course are AI-graded. For these assignments, your data will be used in accordance with Coursera's Privacy Notice.