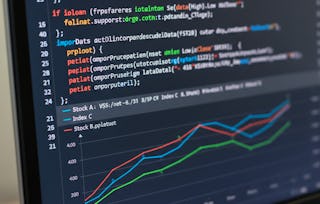
Learners will be able to apply Python programming fundamentals, analyze real-world financial data, visualize market trends, and interpret key financial indicators using industry-relevant tools and techniques.
Apply Python for Practical Financial Data Analysis
Ask Coursera
Gain insight into a topic and learn the fundamentals.
Beginner level
Recommended experience
5 hours to complete
Flexible schedule
Learn at your own pace
What you'll learn
Apply Python fundamentals to analyze real-world financial datasets.
Visualize market trends using charts, indicators, and candlestick plots.
Interpret correlations and moving averages to support decisions.
Skills you'll gain
Tools you'll learn
Details to know

Shareable certificate
Add to your LinkedIn profile
Recently updated!
February 2026
Assessments
8 assignments
Taught in English
See how employees at top companies are mastering in-demand skills

Explore more from Data Analysis
 Status: Preview
 Status: Preview
The Hong Kong University of Science and Technology
 Status: Free Trial
Corporate Finance Institute

Why people choose Coursera for their career

Felipe M.
Learner since 2018
"To be able to take courses at my own pace and rhythm has been an amazing experience. I can learn whenever it fits my schedule and mood."

Jennifer J.
Learner since 2020
"I directly applied the concepts and skills I learned from my courses to an exciting new project at work."

Larry W.
Learner since 2021
"When I need courses on topics that my university doesn't offer, Coursera is one of the best places to go."

Chaitanya A.
"Learning isn't just about being better at your job: it's so much more than that. Coursera allows me to learn without limits."
Advance your career with an online degree
Earn a degree from world-class universities - 100% online


