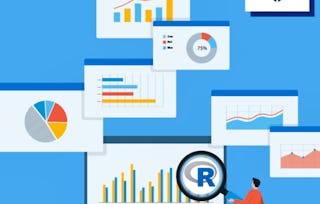
In this course, you'll embark on a journey to master data visualization using R, one of the most popular programming languages among data scientists. Starting with the basics, you'll learn how to set up R and RStudio, ensuring your environment is ready for data analysis. You'll then acquire data from the US National Weather Service, focusing on real-world data to make the learning process relevant and engaging. The initial module walks you through inspecting the data to understand its structure and nuances.
New year. Big goals. Bigger savings. Unlock a year of unlimited access to learning with Coursera Plus for $199. Save now.
Recommended experience
What you'll learn
Identify and list the steps to install and configure R and RStudio
Describe the structure and purpose of different data types in R
Use R to import and inspect datasets from external sources
Create scatter plots and apply linear regression models to identify trends in data
Skills you'll gain
Details to know
Add to your LinkedIn profile
October 2024
1 assignment
See how employees at top companies are mastering in-demand skills
Earn a career certificate
Add this credential to your LinkedIn profile, resume, or CV
Share it on social media and in your performance review
There are 4 modules in this course
In this module, we will introduce the course and its objectives, ensuring you understand what to expect. We will guide you through installing R and RStudio, obtaining relevant data from the US National Weather Service, and inspecting the data to comprehend its structure and content.
What's included
5 videos1 reading
In this module, we will delve into coding practices essential for data analysis in R. You'll start by reading data into R and understanding the different data types. We'll cover creating visual data representations, building and assessing linear regression models, and automating plot generation using loops. Finally, you'll learn to display multiple graphs together for comprehensive data comparison.
What's included
7 videos
In this module, we will explore the installation and use of R packages, specifically focusing on the ggplot2 package for data visualization. You will learn to leverage pre-written functions to simplify your coding process and create sophisticated plots. By the end of this section, you will be able to plot and highlight specific data points, such as minimum and maximum temperatures, customize the aesthetics of your plots, and analyze data trends through enhanced graphical representations.
What's included
2 videos
In this module, we will wrap up the course, summarizing the key concepts and skills you have acquired. We will reflect on how you can apply what you've learned in R and RStudio to real-world data analysis projects. Additionally, we will discuss potential next steps for further learning and skill enhancement in data science and programming with R. Lastly, we will provide resources and guidance for continued practice and exploration to further solidify your understanding and expertise.
What's included
1 video1 assignment
Instructor
Offered by
Recommended if you're interested in Data Management
Coursera Project Network
University at Buffalo
Coursera Project Network
Johns Hopkins University
Why people choose Coursera for their career
New to Data Management? Start here.
Open new doors with Coursera Plus
Unlimited access to 10,000+ world-class courses, hands-on projects, and job-ready certificate programs - all included in your subscription
Advance your career with an online degree
Earn a degree from world-class universities - 100% online
Join over 3,400 global companies that choose Coursera for Business
Upskill your employees to excel in the digital economy
Frequently asked questions
Yes, you can preview the first video and view the syllabus before you enroll. You must purchase the course to access content not included in the preview.
If you decide to enroll in the course before the session start date, you will have access to all of the lecture videos and readings for the course. You’ll be able to submit assignments once the session starts.
Once you enroll and your session begins, you will have access to all videos and other resources, including reading items and the course discussion forum. You’ll be able to view and submit practice assessments, and complete required graded assignments to earn a grade and a Course Certificate.