When you enroll in this course, you'll also be enrolled in this Specialization.
Learn new concepts from industry experts
Gain a foundational understanding of a subject or tool
Develop job-relevant skills with hands-on projects
Earn a shareable career certificate
There are 5 modules in this course
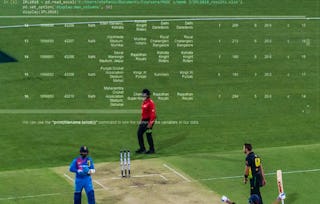
The book Moneyball triggered a revolution in the analysis of performance statistics in professional sports, by showing that data analytics could be used to increase team winning percentage. This course shows how to program data using Python to test the claims that lie behind the Moneyball story, and to examine the evolution of Moneyball statistics since the book was published. The learner is led through the process of calculating baseball performance statistics from publicly available datasets. The course progresses from the analysis of on base percentage and slugging percentage to more advanced measures derived using the run expectancy matrix, such as wins above replacement (WAR). By the end of this course the learner will be able to use these statistics to conduct their own team and player analyses.
In this module we introduce the Moneyball story and explore the method used to test that story. We begin the process of replicating the moneyball test by establishing the relationship between team winning and and two performance statistics - on base percentage (OBP) and slugging percentage (SLG).
What's included
5 videos10 readings3 assignments2 ungraded labs
Show info about module content
5 videos•Total 61 minutes
Introduction to Moneyball•7 minutes
Reproducing Table 1 of Hakes and Sauer - Part 1•19 minutes
Reproducing Table 1 of Hakes and Sauer - Part 2•13 minutes
Reproducing Table 1 of Hakes and Sauer- Part 3•13 minutes
Reproducing Table 1 of Hakes and Sauer - Part 4•10 minutes
10 readings•Total 95 minutes
Course Syllabus•10 minutes
Help Us Learn More About You•5 minutes
Week 1 - Assignment Overview•10 minutes
Assignment - Part 1•10 minutes
Sample Notebook - Part 1•10 minutes
Assignment - Part 2•10 minutes
Sample Notebook - Part 2•10 minutes
Assignment - Part 3•10 minutes
Sample Notebook - Full Sample•10 minutes
Week 1 R Content•10 minutes
3 assignments•Total 90 minutes
Week 1 - Quiz 1•30 minutes
Week 1 - Quiz 2•30 minutes
Week 1 - Quiz 3•30 minutes
2 ungraded labs•Total 120 minutes
Lecture - H&S Table•60 minutes
Assignment 1 Workspace•60 minutes
Week 2
Module 2•6 hours to complete
Module details
In this module we estimate the relationship between MLB player salaries and their performance statistics, OBP (on base percentage) and SLG (slugging). The results appear to confirm the Moneyball story - OBP was undervalued relative to SLG prior to the publication of Moneyball, while after publication the relative significance is reversed.
What's included
6 videos8 readings3 assignments2 ungraded labs
Show info about module content
6 videos•Total 57 minutes
Reproducing Table 3 of Hakes and Sauer- Part 1•9 minutes
Reproducing Table 3 of Hakes and Sauer- Part 2•6 minutes
Reproducing Table 3 of Hakes and Sauer- Part 3•10 minutes
Reproducing Table 3 of Hakes and Sauer- Part 4•11 minutes
Reproducing Table 3 of Hakes and Sauer- Part 5•10 minutes
Reproducing Table 3 of Hakes and Sauer- Part 6•11 minutes
8 readings•Total 80 minutes
Moneyball Week 2 - Assignment Overview•10 minutes
Assignment - Part 1•10 minutes
Sample Notebook - Part 1•10 minutes
Assignment - Part 2•10 minutes
Sample Notebook - Part 2•10 minutes
Assignment - Part 3•10 minutes
Sample Notebook - Full Sample•10 minutes
Week 2 R Content•10 minutes
3 assignments•Total 90 minutes
Week 2 - Quiz 1•30 minutes
Week 2 - Quiz 2•30 minutes
Week 2 - Quiz 3•30 minutes
2 ungraded labs•Total 120 minutes
Lecture - Moneyball Table 3•60 minutes
Assignment 2 Workspace•60 minutes
Week 3
Module 3•6 hours to complete
Module details
This module updates the analysis of Hakes & Sauer and estimates the rewards to OBP and SLG over the period 1994 -2015. In addition it shows how rewards can be related to individual components of SLG: walks, singles, doubles, triples, and home runs.
What's included
6 videos9 readings3 assignments2 ungraded labs
Show info about module content
6 videos•Total 55 minutes
Moneyball update Part 1•5 minutes
Moneyball update Part 2•7 minutes
Moneyball Update Part 3•9 minutes
Moneyball Update Part 4•12 minutes
Moneyball Update Part 5•8 minutes
Moneyball Update Part 6•13 minutes
9 readings•Total 90 minutes
Moneyball Week 3 - Assignment Overview•10 minutes
Assignment - Part 1•10 minutes
Sample Notebook - Part 1•10 minutes
Assignment - Part 2•10 minutes
Sample Notebook - Part 2•10 minutes
Assignment - Part 3•10 minutes
Sample Notebook - Part 3•10 minutes
Sample Notebook in R•10 minutes
Week 3 R Content•10 minutes
3 assignments•Total 66 minutes
Week 3 - Quiz 1•30 minutes
Week 3 - Quiz 2•6 minutes
Week 3 - Quiz 3•30 minutes
2 ungraded labs•Total 120 minutes
Lecture - Moneyball Update•60 minutes
Assignment 3 Workspace•60 minutes
Week 4
Module 4•6 hours to complete
Module details
This module introduces the concept of run expectancy, shows how to derive the run expectancy matrix and the calculation of run values based on an MLB dataset of all events in the 2018 season. Run values are calculated by event type (walks, singles, doubles, etc.) and by player.
What's included
4 videos9 readings3 assignments2 ungraded labs
Show info about module content
4 videos•Total 44 minutes
Beyond Moneyball: Run expectancy Part 1•11 minutes
Beyond Moneyball: Run Expectancy Part 2•12 minutes
Beyond Moneyball: Run expectancy Part 3•12 minutes
Beyond Moneyball: Run expectancy Part 4•9 minutes
9 readings•Total 90 minutes
Moneyball Week 4 - Assignment Overview•10 minutes
Assignment - Part 1•10 minutes
Sample Notebook - Part 1•10 minutes
Assignment - Part 2•10 minutes
Sample Notebook - Part 2•10 minutes
Assignment - Part 3•10 minutes
Sample Notebook - Part 3•10 minutes
Sample Notebook in R•10 minutes
Week 4 R Content•10 minutes
3 assignments•Total 90 minutes
Week 4 - Quiz 1•30 minutes
Week 4 - Quiz 2•30 minutes
Week 4 - Quiz 3•30 minutes
2 ungraded labs•Total 120 minutes
Lecture - Run Expectancy•60 minutes
Assignment 4 Workspace•60 minutes
Week 5
Module 5•6 hours to complete
Module details
This module examines the concept of Wins Above Replacement (WAR) and shows how to calculate WAR based on batting performance. The relationship between play run values team win percentage and player salaries is then explored. Run values are shown to have a high degree of correlation with winning and with salaries. Run values can to a limited extent predict win percentage.
What's included
4 videos9 readings3 assignments2 ungraded labs
Show info about module content
4 videos•Total 39 minutes
Beyond Moneyball: Run values and WAR Part 1•7 minutes
Beyond Moneyball: Run values and WAR Part 2•9 minutes
Beyond Moneyball: Run values and WAR Part 3•12 minutes
Beyond Moneyball: Run values and WAR Part 4•11 minutes
9 readings•Total 85 minutes
Moneyball Week 5 - Assignment Overview•10 minutes
Assignment - Part 1•10 minutes
Sample Notebook - Part 1•10 minutes
Assignment - Part 2•10 minutes
Sample Notebook - Part 2•10 minutes
Assignment - Part 3•10 minutes
Sample Notebook - Part 3•10 minutes
Post-Course Survey•5 minutes
Week 5 R Content•10 minutes
3 assignments•Total 90 minutes
Week 5 - Quiz 1•30 minutes
Week 5 - Quiz 2•30 minutes
Week 5 - Quiz 3•30 minutes
2 ungraded labs•Total 120 minutes
Lecture - From Run Expectancy to WAR•60 minutes
Assignment 5 Workspace•60 minutes
Earn a career certificate
Add this credential to your LinkedIn profile, resume, or CV. Share it on social media and in your performance review.
Instructor
Instructor ratings
Instructor ratings
We asked all learners to give feedback on our instructors based on the quality of their teaching style.
The mission of the University of Michigan is to serve the people of Michigan and the world through preeminence in creating, communicating, preserving and applying knowledge, art, and academic values, and in developing leaders and citizens who will challenge the present and enrich the future.
When will I have access to the lectures and assignments?
To access the course materials, assignments and to earn a Certificate, you will need to purchase the Certificate experience when you enroll in a course. You can try a Free Trial instead, or apply for Financial Aid. The course may offer 'Full Course, No Certificate' instead. This option lets you see all course materials, submit required assessments, and get a final grade. This also means that you will not be able to purchase a Certificate experience.
What will I get if I subscribe to this Specialization?
When you enroll in the course, you get access to all of the courses in the Specialization, and you earn a certificate when you complete the work. Your electronic Certificate will be added to your Accomplishments page - from there, you can print your Certificate or add it to your LinkedIn profile.
Is financial aid available?
Yes. In select learning programs, you can apply for financial aid or a scholarship if you can’t afford the enrollment fee. If fin aid or scholarship is available for your learning program selection, you’ll find a link to apply on the description page.