• For Individuals
  • For Businesses
  • For Universities
  • For Governments
Degrees
​
Log In
Join for Free
  • Browse
  • Ggplot 2

Results for "ggplot2"


  • C

    Coursera

    Demand Planning in RStudio: Create Demand Forecast

    Skills you'll gain: Demand Planning, Customer Demand Planning, Supply Chain Planning, Production Planning, Forecasting, Time Series Analysis and Forecasting, Trend Analysis, Inventory Management System, Data Analysis, R Programming, Data Visualization, R (Software), Model Evaluation

    Intermediate · Guided Project · Less Than 2 Hours

  • Status: Free Trial
    Free Trial
    V

    Vanderbilt University

    From Data to Decisions: Finding Patterns with AI

    Skills you'll gain: Statistical Methods, Statistical Analysis, Data Visualization, Generative AI, Statistical Hypothesis Testing, Data Presentation, Data Storytelling, Box Plots, Data Analysis, Plot (Graphics), Data-Driven Decision-Making, Statistics, Technical Communication, Statistical Inference, Graphing

    4.9
    Rating, 4.9 out of 5 stars
    ·
    8 reviews

    Beginner · Course · 1 - 4 Weeks

  • Status: Free Trial
    Free Trial
    J

    Johns Hopkins University

    The R Programming Environment

    Skills you'll gain: Tidyverse (R Package), Web Scraping, Data Manipulation, R Programming, Data Transformation, Data Cleansing, Big Data, Statistical Programming, Text Mining, Data Import/Export, Data Analysis, Data Structures, Performance Tuning, Application Programming Interface (API)

    4.3
    Rating, 4.3 out of 5 stars
    ·
    1.2K reviews

    Intermediate · Course · 1 - 3 Months

  • Status: Free Trial
    Free Trial
    U

    University of Pittsburgh

    Data Visualization: Fundamentals to Interactive Storytelling

    Skills you'll gain: Data Storytelling, Interactive Data Visualization, Data Presentation, Plot (Graphics), Data Visualization Software, Data Visualization, Tableau Software, Spatial Analysis, Visualization (Computer Graphics), Statistical Visualization, Network Model, Dashboard, Matplotlib, Infographics, Heat Maps, Seaborn, Geospatial Information and Technology, Time Series Analysis and Forecasting, Network Analysis, Geospatial Mapping

    Build toward a degree

    Intermediate · Specialization · 3 - 6 Months

  • C

    Coursera

    Introduction to R: Basic R syntax

    Skills you'll gain: R Programming, Arithmetic, Statistical Programming, Development Environment, Programming Principles, Data Import/Export

    4.5
    Rating, 4.5 out of 5 stars
    ·
    49 reviews

    Beginner · Guided Project · Less Than 2 Hours

  • Status: New
    New
    Status: Free Trial
    Free Trial
    E

    EDUCBA

    Seaborn Python: Design & Customize Advanced Visualizations

    Skills you'll gain: Seaborn, Plot (Graphics), Matplotlib, Exploratory Data Analysis, Data Visualization Software, Statistical Visualization, Data Storytelling, Scatter Plots, Pandas (Python Package)

    Mixed · Course · 1 - 4 Weeks

Searches related to ggplot2

data visualization in r with ggplot2
data visualization using dplyr and ggplot2 in r
ggplot
1…9101112

In summary, here are 6 of our most popular ggplot2 courses

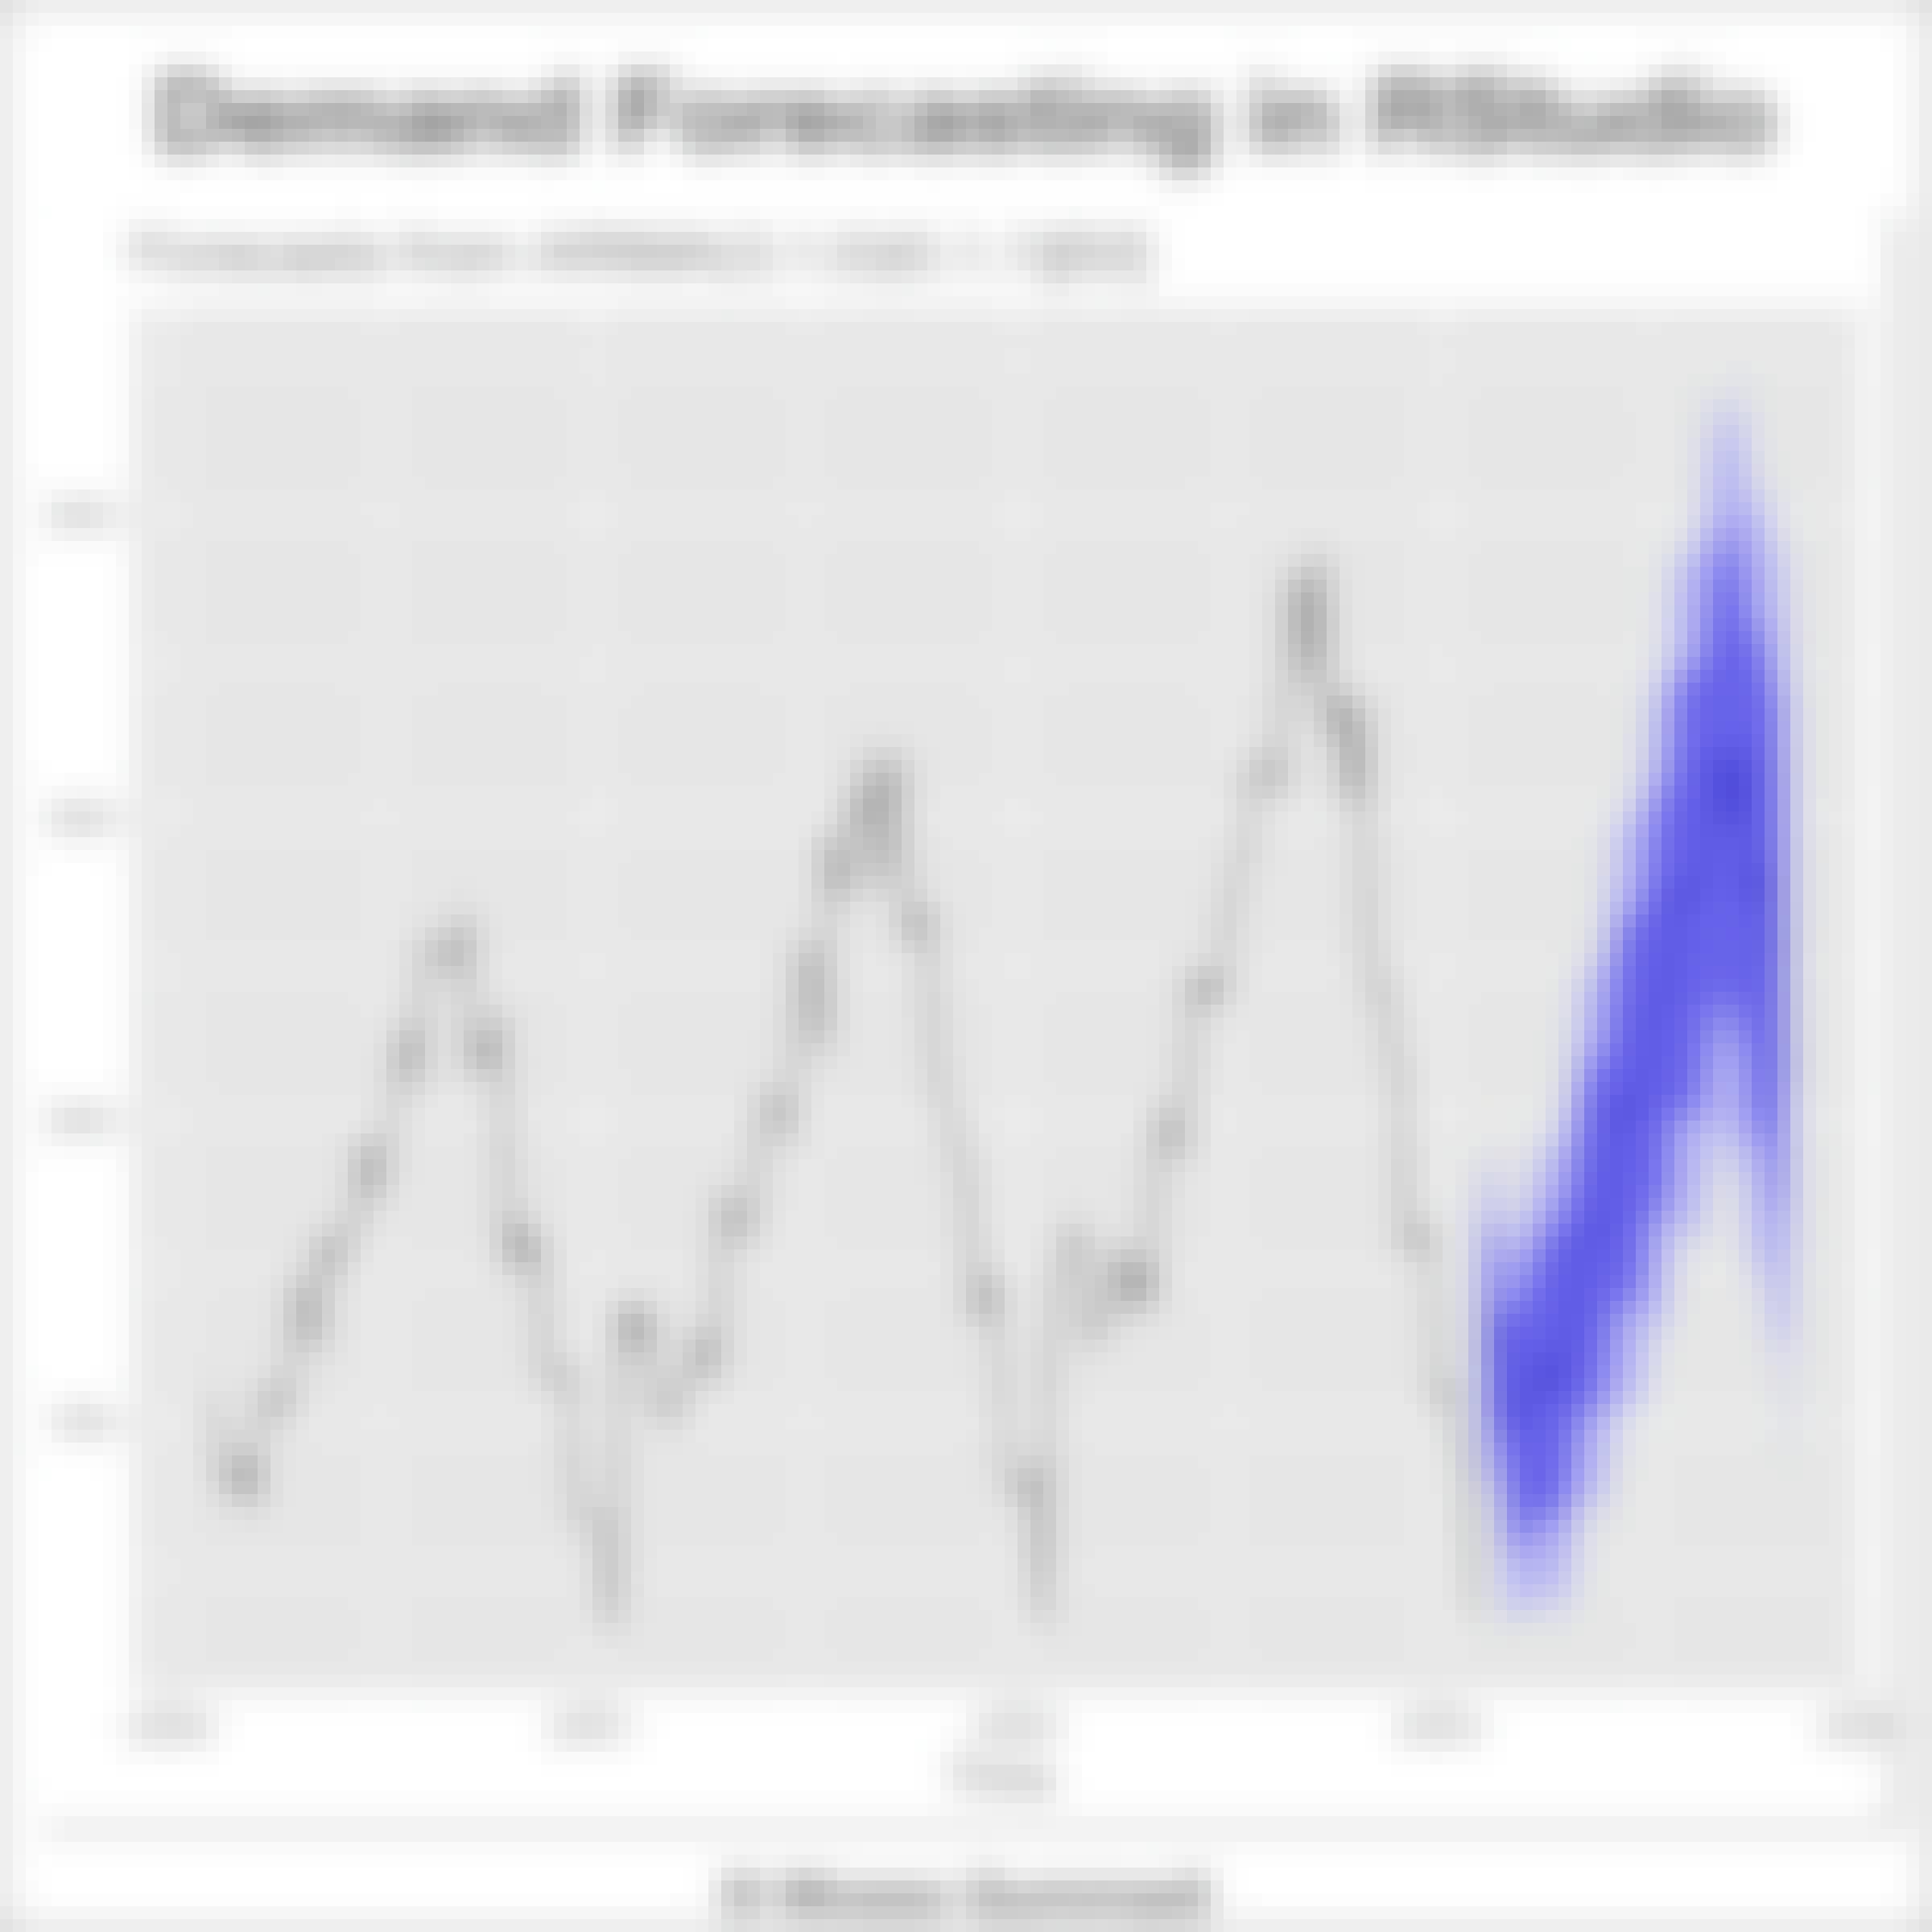
  • Demand Planning in RStudio: Create Demand Forecast: Coursera
  • From Data to Decisions: Finding Patterns with AI: Vanderbilt University
  • The R Programming Environment: Johns Hopkins University
  • Data Visualization: Fundamentals to Interactive Storytelling: University of Pittsburgh
  • Introduction to R: Basic R syntax: Coursera
  • Seaborn Python: Design & Customize Advanced Visualizations: EDUCBA

Other topics to explore

Arts and Humanities
338 courses
Business
1095 courses
Computer Science
668 courses
Data Science
425 courses
Information Technology
145 courses
Health
471 courses
Math and Logic
70 courses
Personal Development
137 courses
Physical Science and Engineering
413 courses
Social Sciences
401 courses
Language Learning
150 courses

Coursera Footer

Skills

  • Artificial Intelligence (AI)
  • Cybersecurity
  • Data Analytics
  • Digital Marketing
  • English Speaking
  • Generative AI (GenAI)
  • Microsoft Excel
  • Microsoft Power BI
  • Project Management
  • Python

Certificates & Programs

  • Google Cybersecurity Certificate
  • Google Data Analytics Certificate
  • Google IT Support Certificate
  • Google Project Management Certificate
  • Google UX Design Certificate
  • IBM Data Analyst Certificate
  • IBM Data Science Certificate
  • Machine Learning Certificate
  • Microsoft Power BI Data Analyst Certificate
  • UI / UX Design Certificate

Industries & Careers

  • Business
  • Computer Science
  • Data Science
  • Education & Teaching
  • Engineering
  • Finance
  • Healthcare
  • Human Resources (HR)
  • Information Technology (IT)
  • Marketing

Career Resources

  • Career Aptitude Test
  • Examples of Strengths and Weaknesses for Job Interviews
  • High-Income Skills to Learn
  • How Does Cryptocurrency Work?
  • How to Highlight Duplicates in Google Sheets
  • How to Learn Artificial Intelligence
  • Popular Cybersecurity Certifications
  • Preparing for the PMP Certification
  • Signs You Will Get the Job After an Interview
  • What Is Artificial Intelligence?

Coursera

  • About
  • What We Offer
  • Leadership
  • Careers
  • Catalog
  • Coursera Plus
  • Professional Certificates
  • MasterTrack® Certificates
  • Degrees
  • For Enterprise
  • For Government
  • For Campus
  • Become a Partner
  • Social Impact
  • Free Courses
  • Share your Coursera learning story

Community

  • Learners
  • Partners
  • Beta Testers
  • Blog
  • The Coursera Podcast
  • Tech Blog

More

  • Press
  • Investors
  • Terms
  • Privacy
  • Help
  • Accessibility
  • Contact
  • Articles
  • Directory
  • Affiliates
  • Modern Slavery Statement
  • Do Not Sell/Share
Learn Anywhere
Download on the App Store
Get it on Google Play
Logo of Certified B Corporation
© 2026 Coursera Inc. All rights reserved.
  • Coursera Facebook
  • Coursera Linkedin
  • Coursera Twitter
  • Coursera YouTube
  • Coursera Instagram
  • Coursera TikTok